 Help Center
The Metrics Dashboard is used for monitoring key performance indicators and providing an overview of job statuses and service performance to assist in effective job management and decision-making.
Benefits :
- See all critical business metrics in a single, unified view.
- Transform complex data into easy-to-understand visual representations.
- Arrange and resize charts to prioritize the metrics most important to your role.
- Base decisions on real-time performance data rather than guesswork.
At the desktop’s navigation bar, go to Business Metrics > Metric Dashboard.
Open Metric Dashboard Here: https://system.caction.com/dashboard/metric/overview
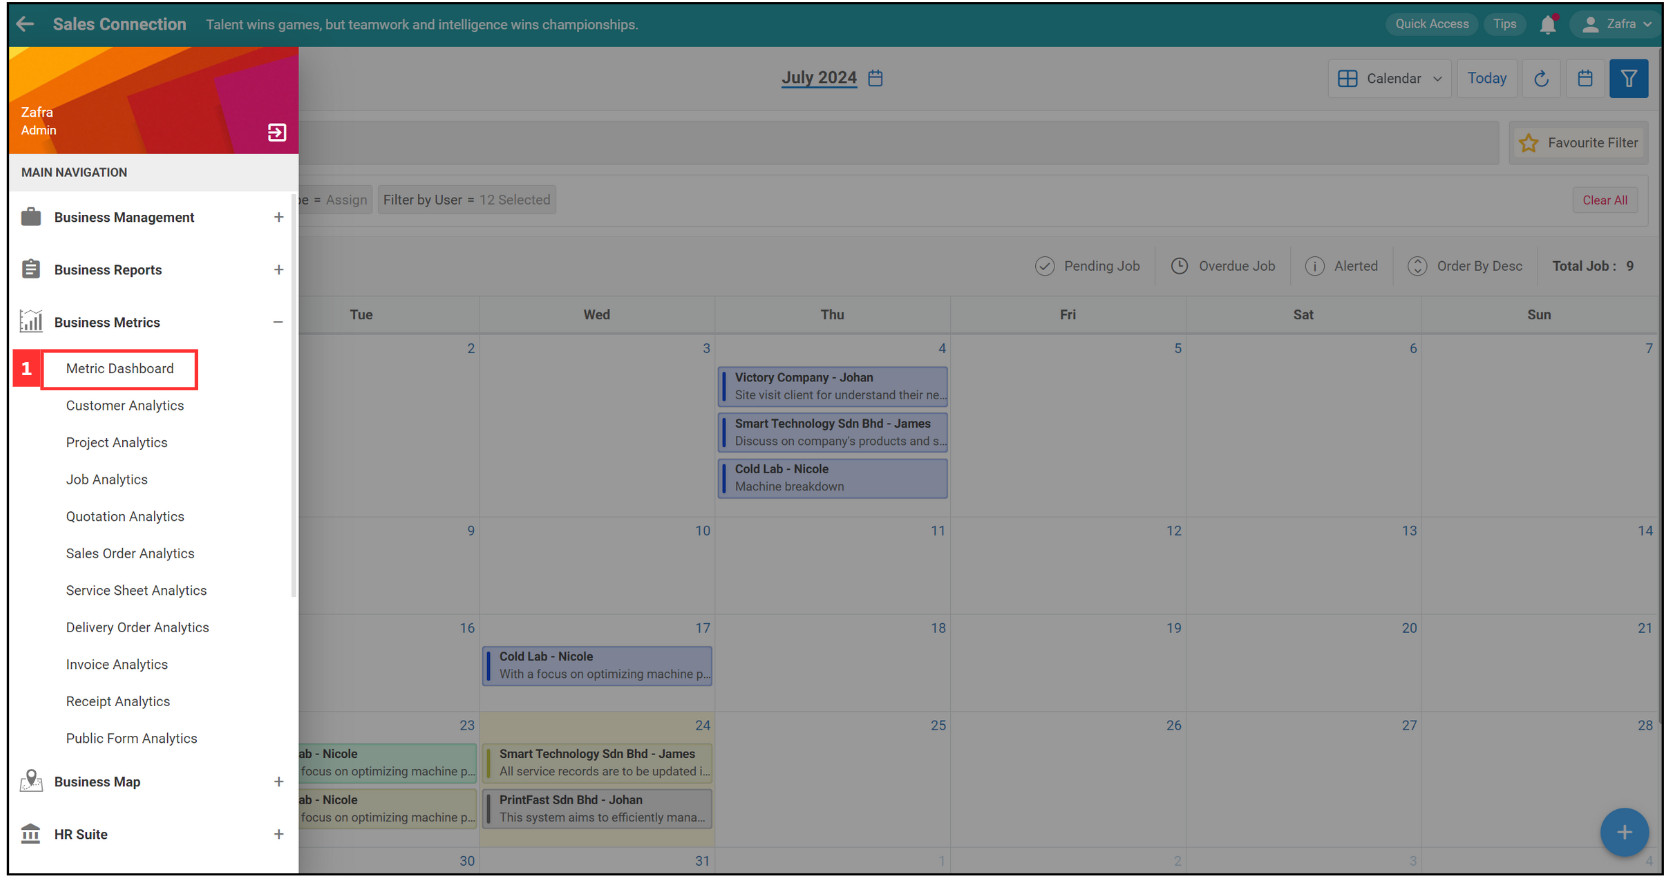
Navigate to the section by clicking it.
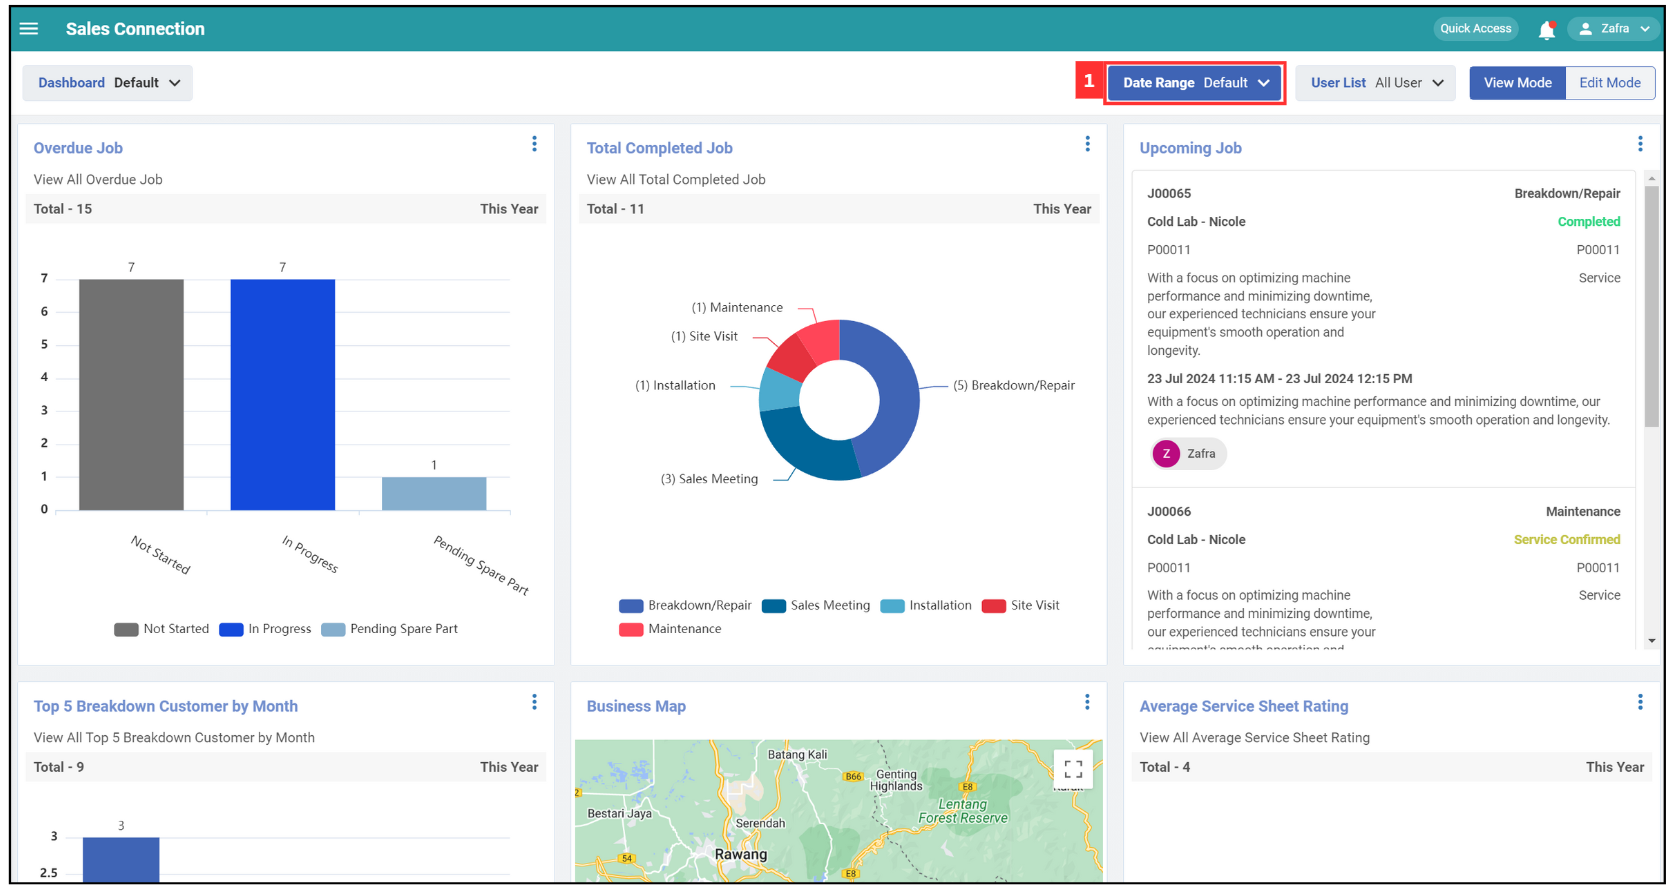
Filter by Date Range
-
Click on the “Date Range”.
-
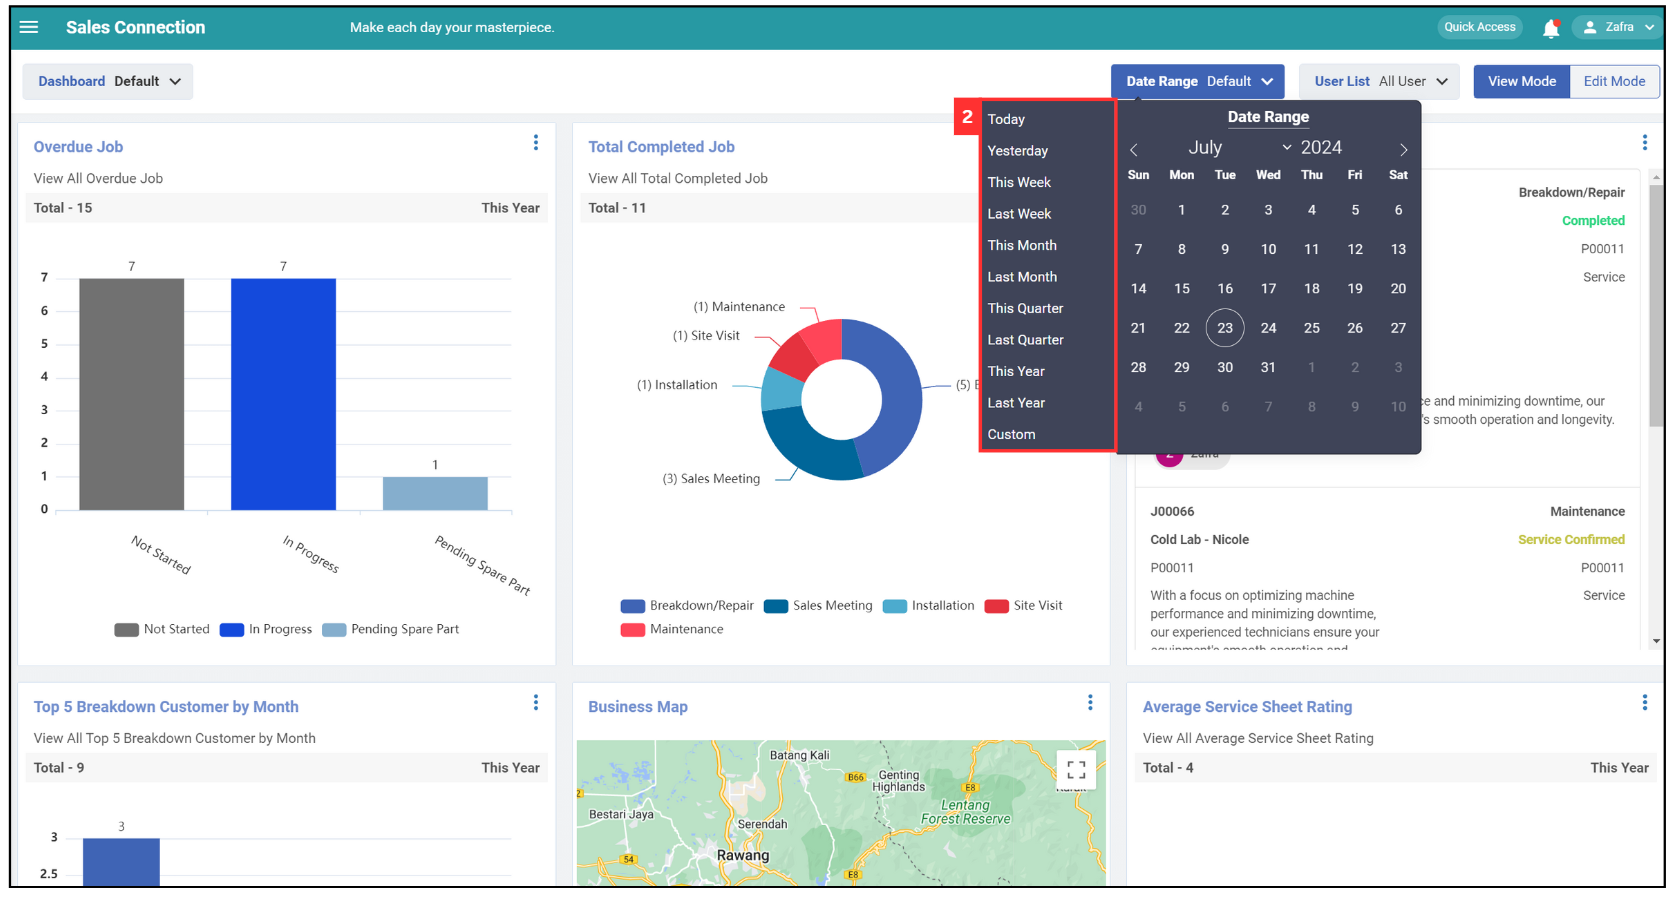
Select the date range of the data you want to view.
-
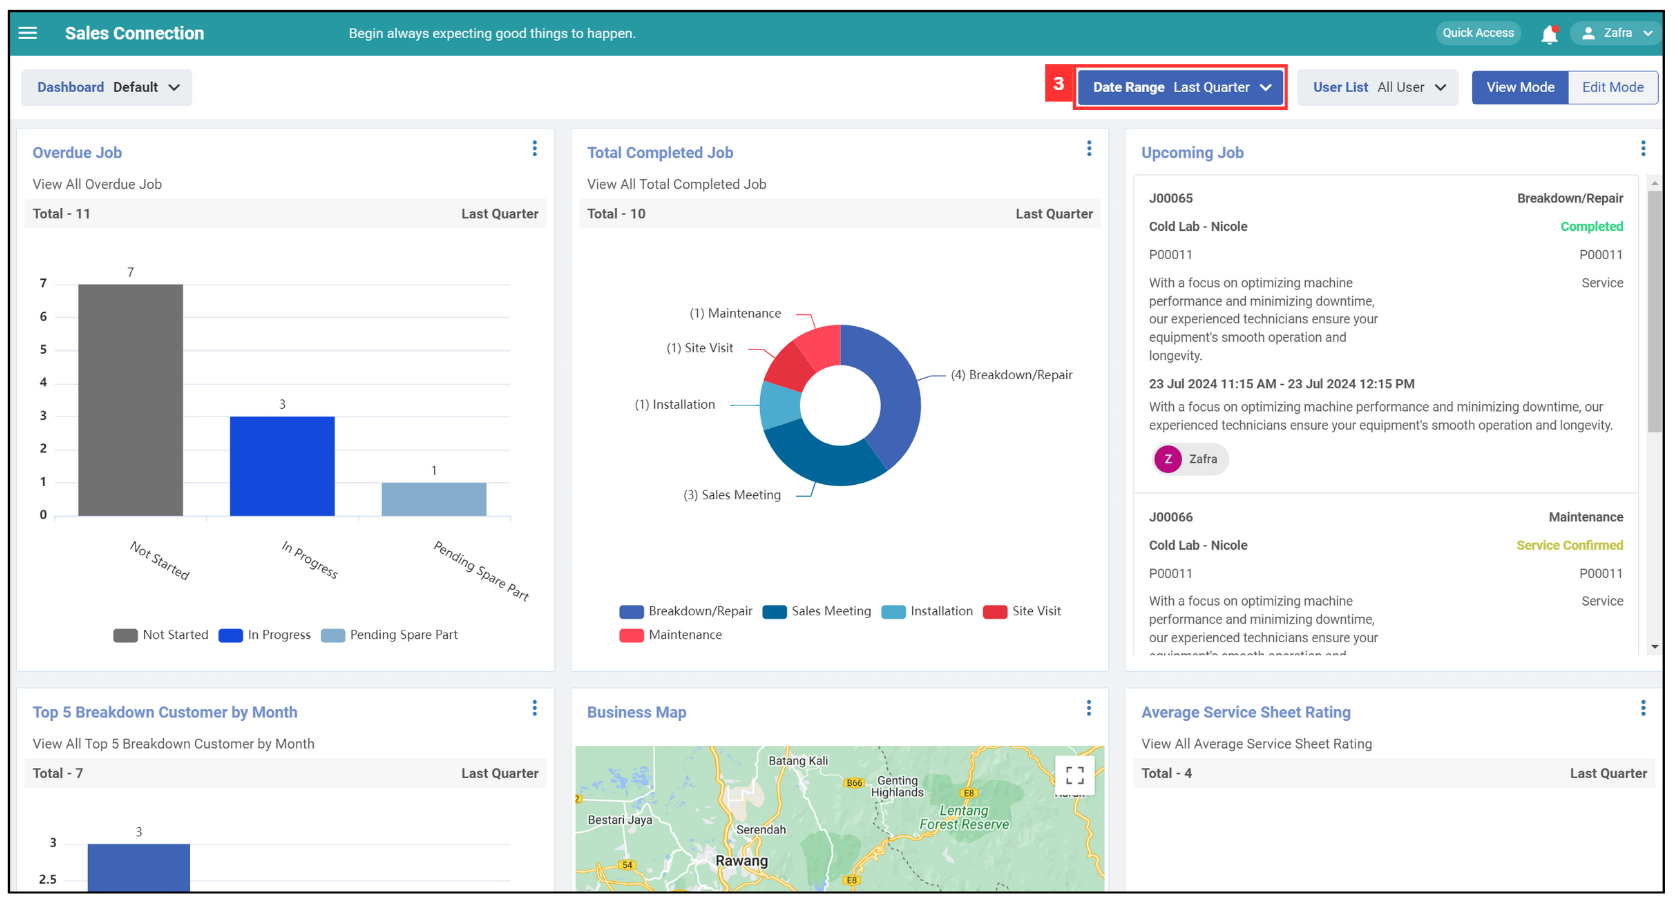
The date range has been applied successfully.
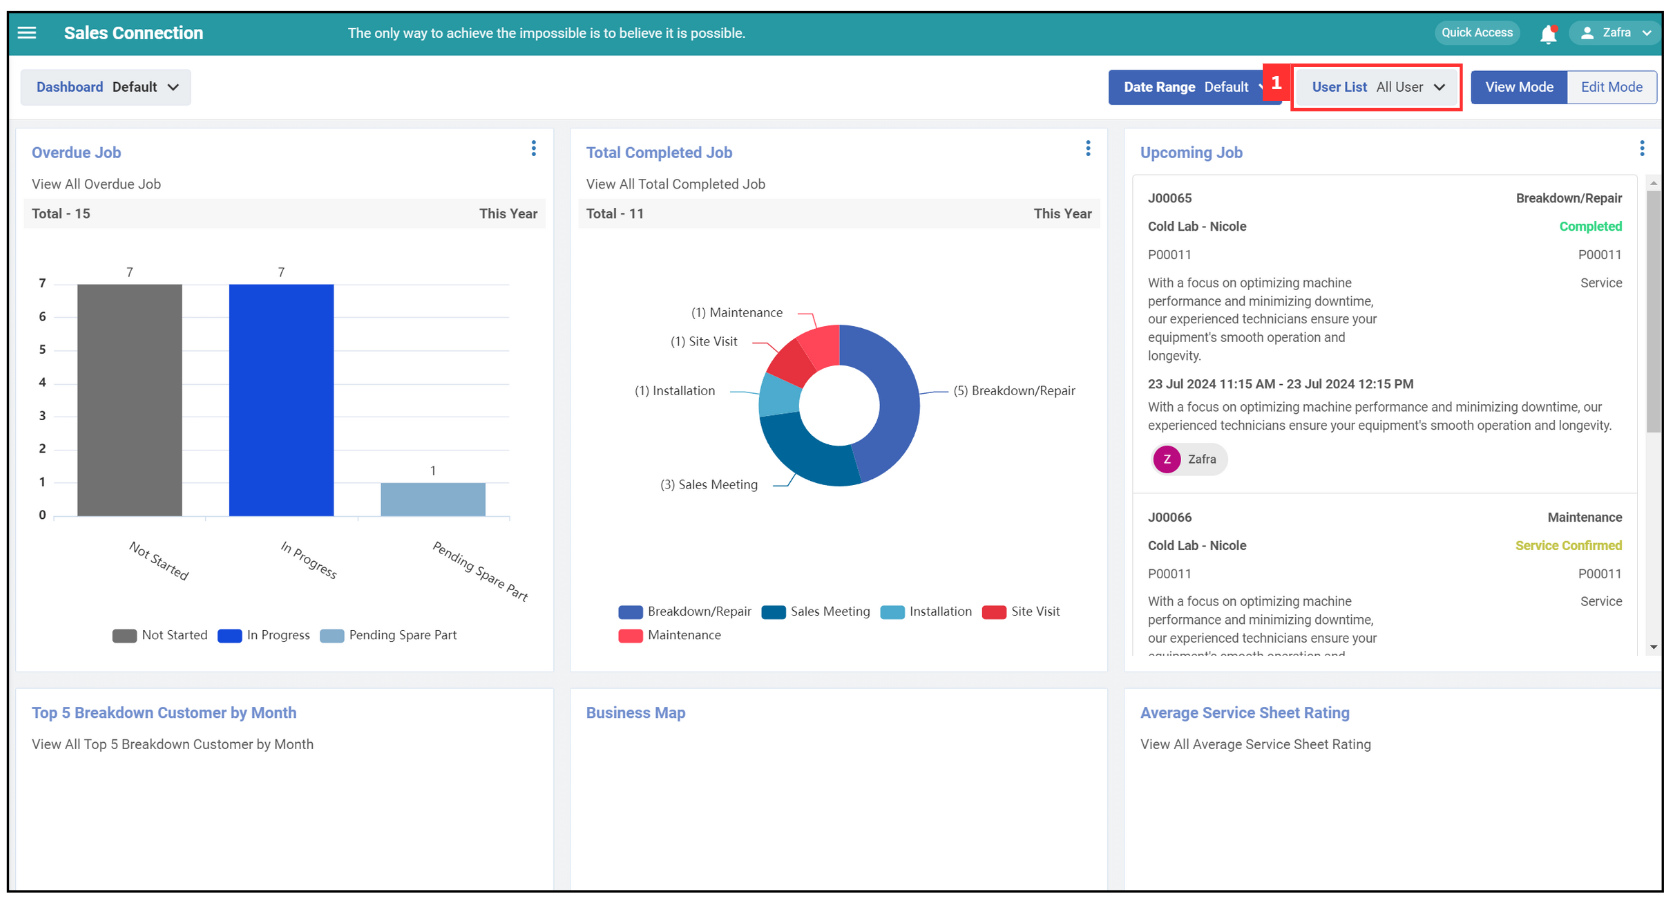
Filter by User List
-
Click on the “User List”.
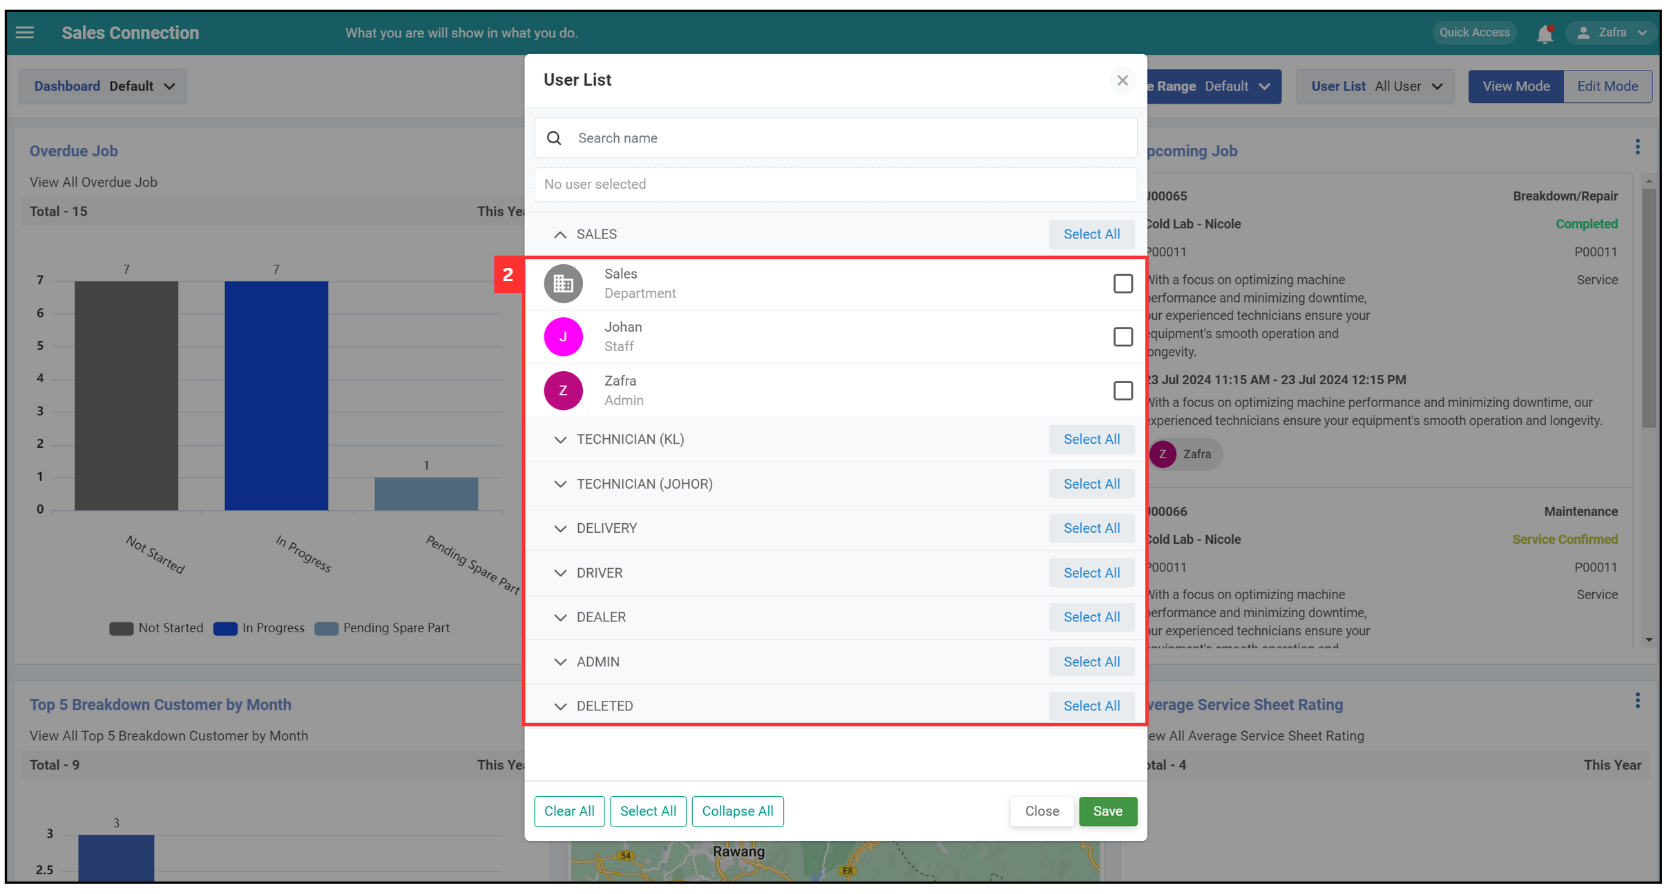
-
Select the user/department’s data you want to view.
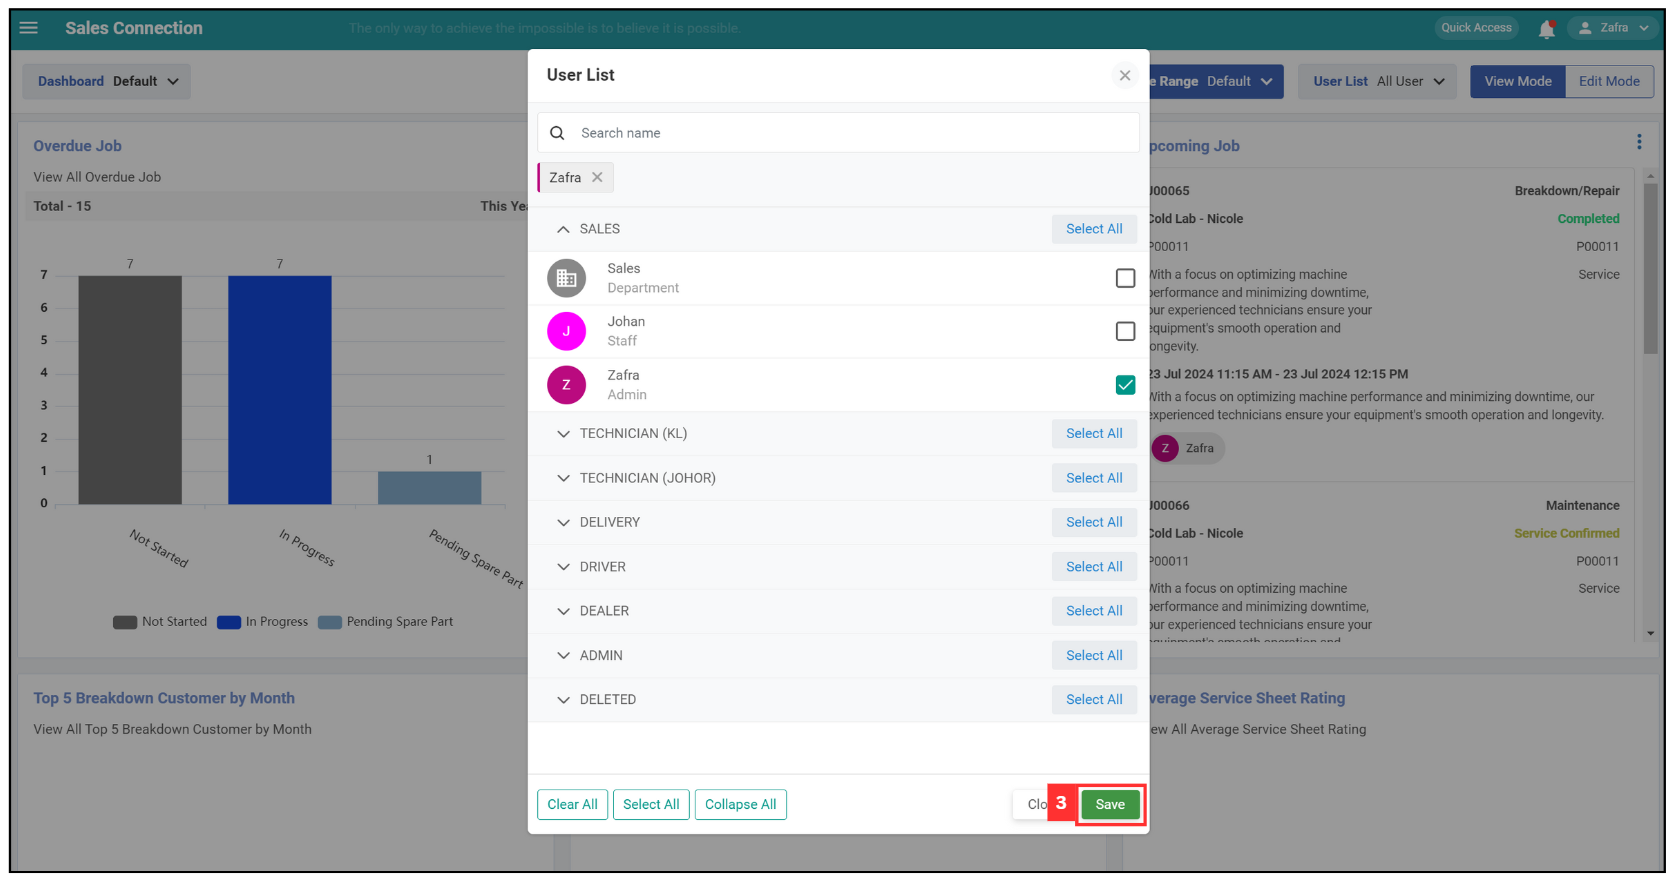
-
Click “Save”.
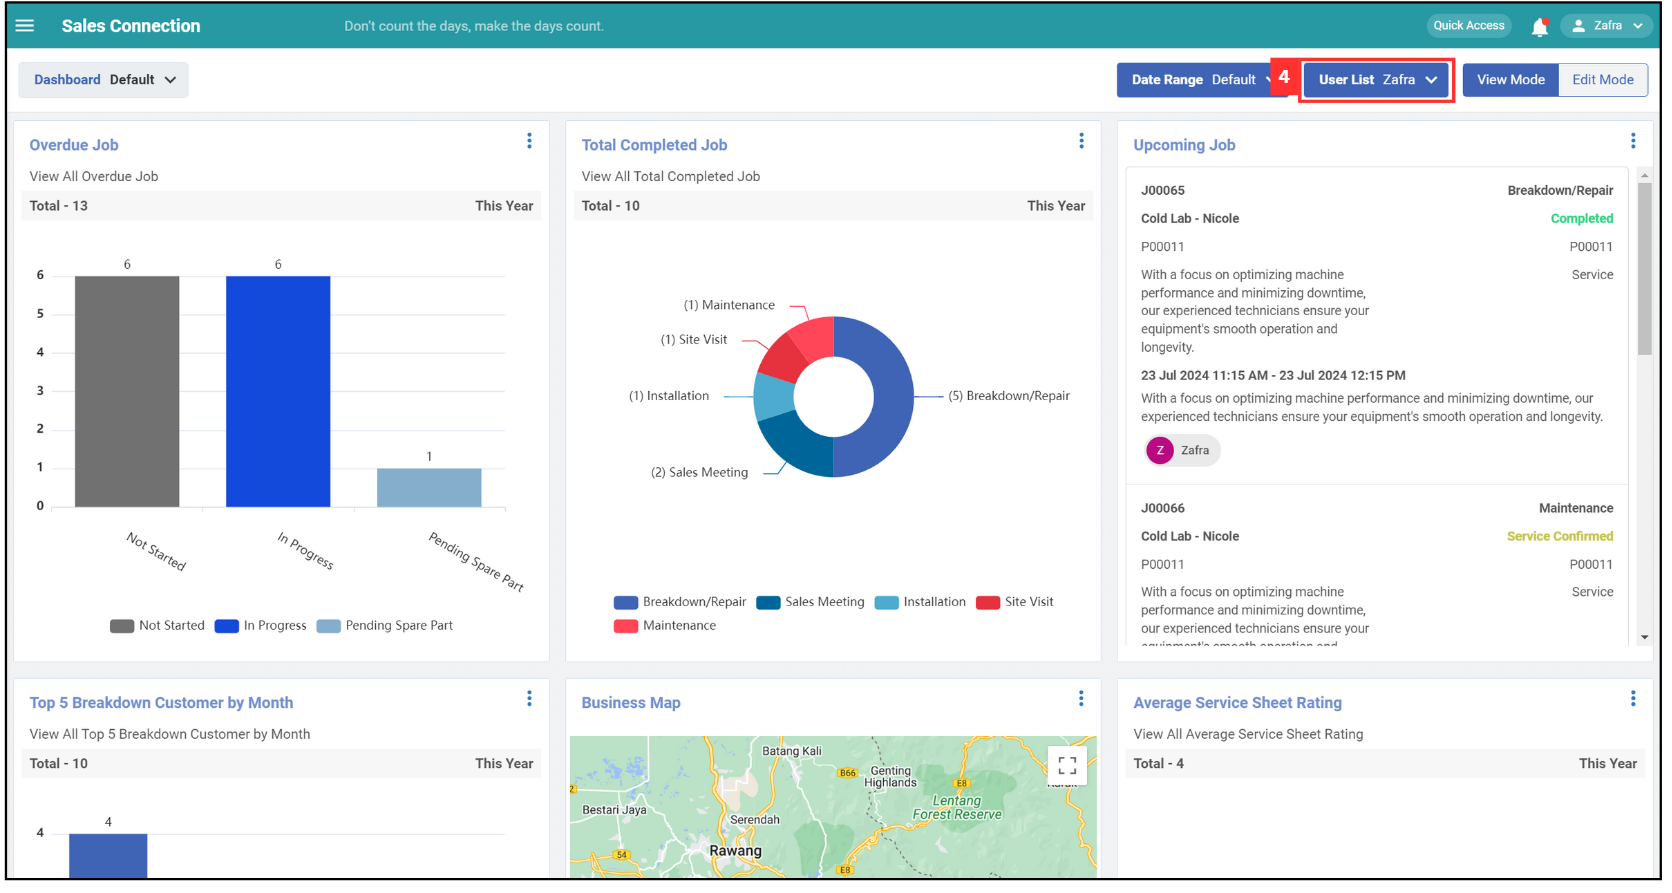
-
The dashboard filter applied by the selected user has been applied successfully.
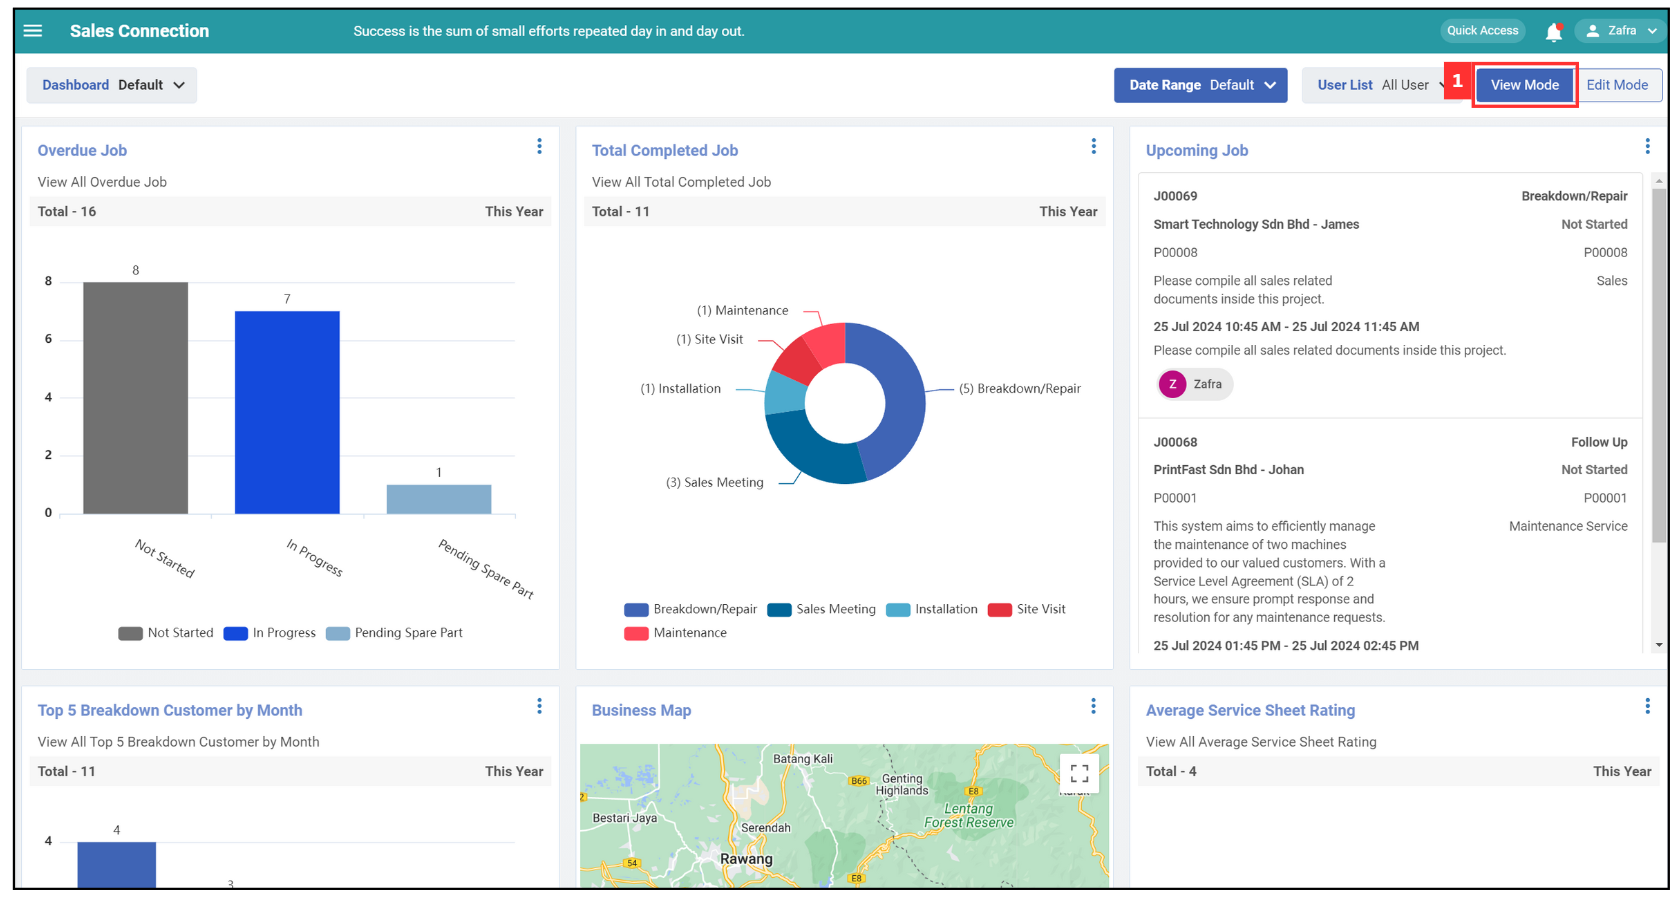
View Mode
-
View Mode will be the default mode when you enter this page.
-
Click on the three dots icon.

-
You can either choose one of them.
Terms Description View More View the full details of the selected chart. Download Chart Download the selected chart in your device. 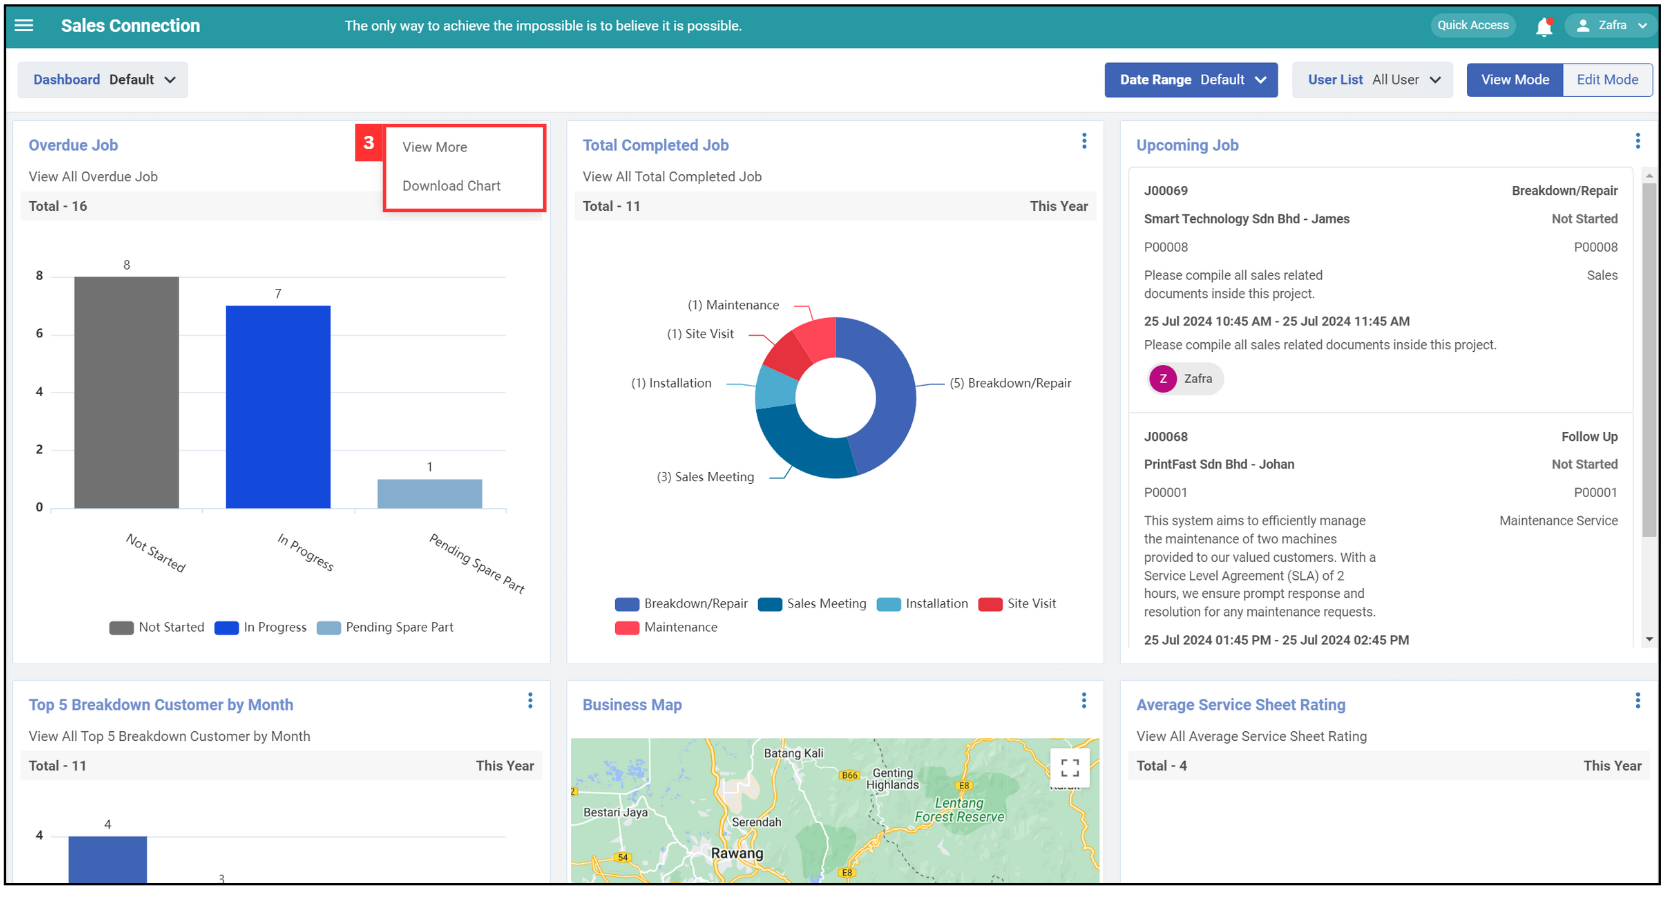
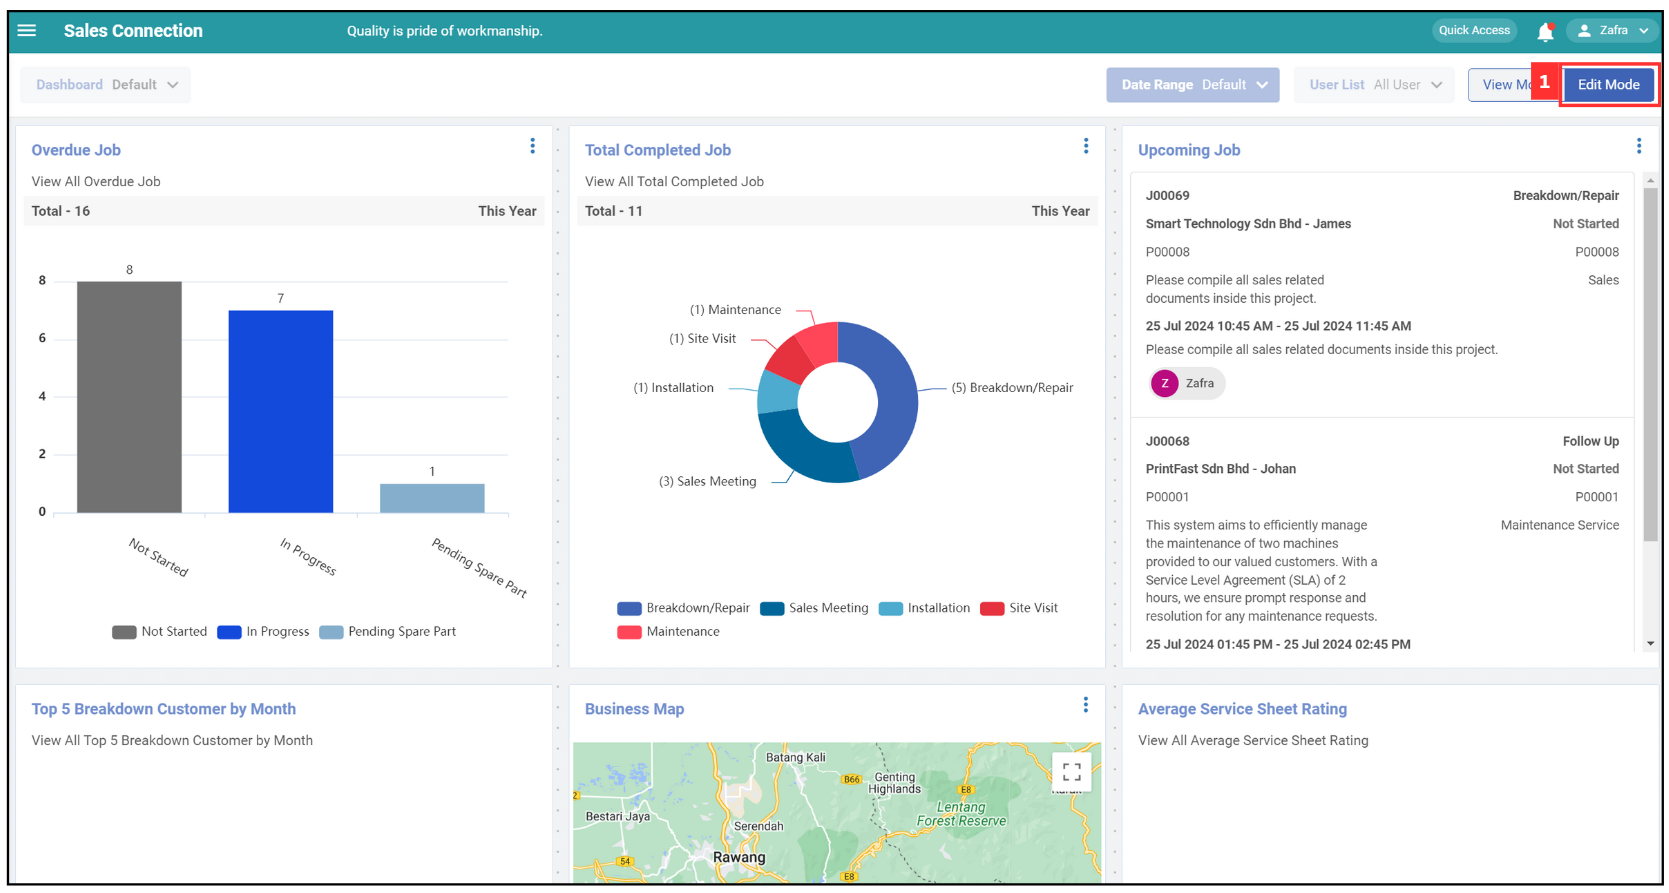
Edit Mode
*Note: Edit Mode in this page is only use for expand the graph and change position.
Resize Chart
-
Click “Edit Mode”.
-
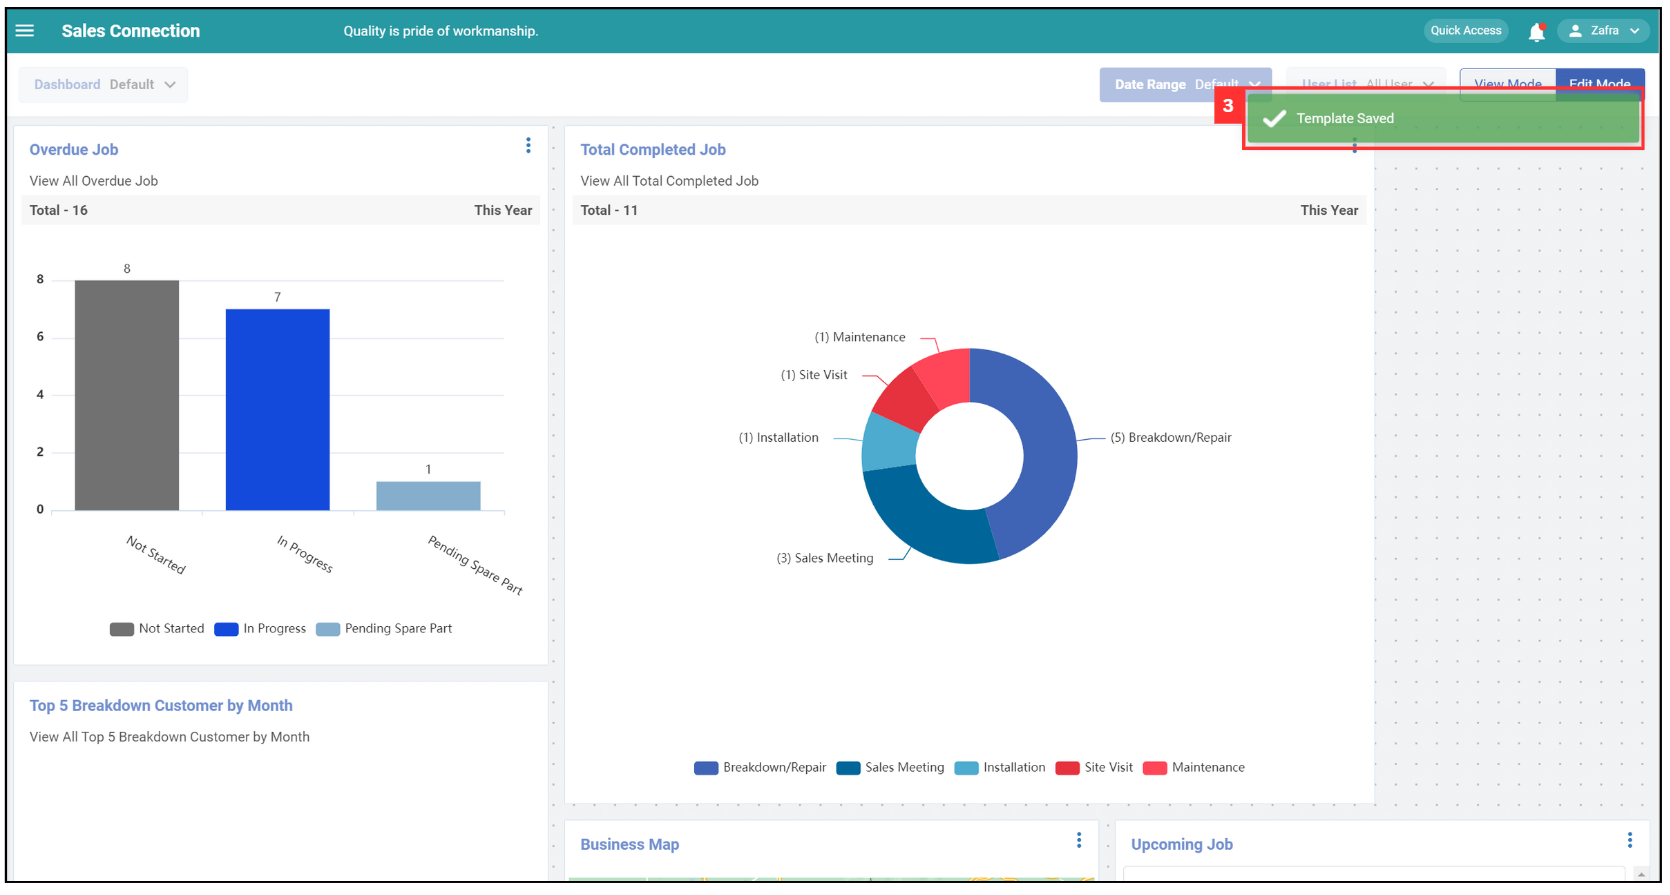
Click on the three dots icon to adjust the graph size.
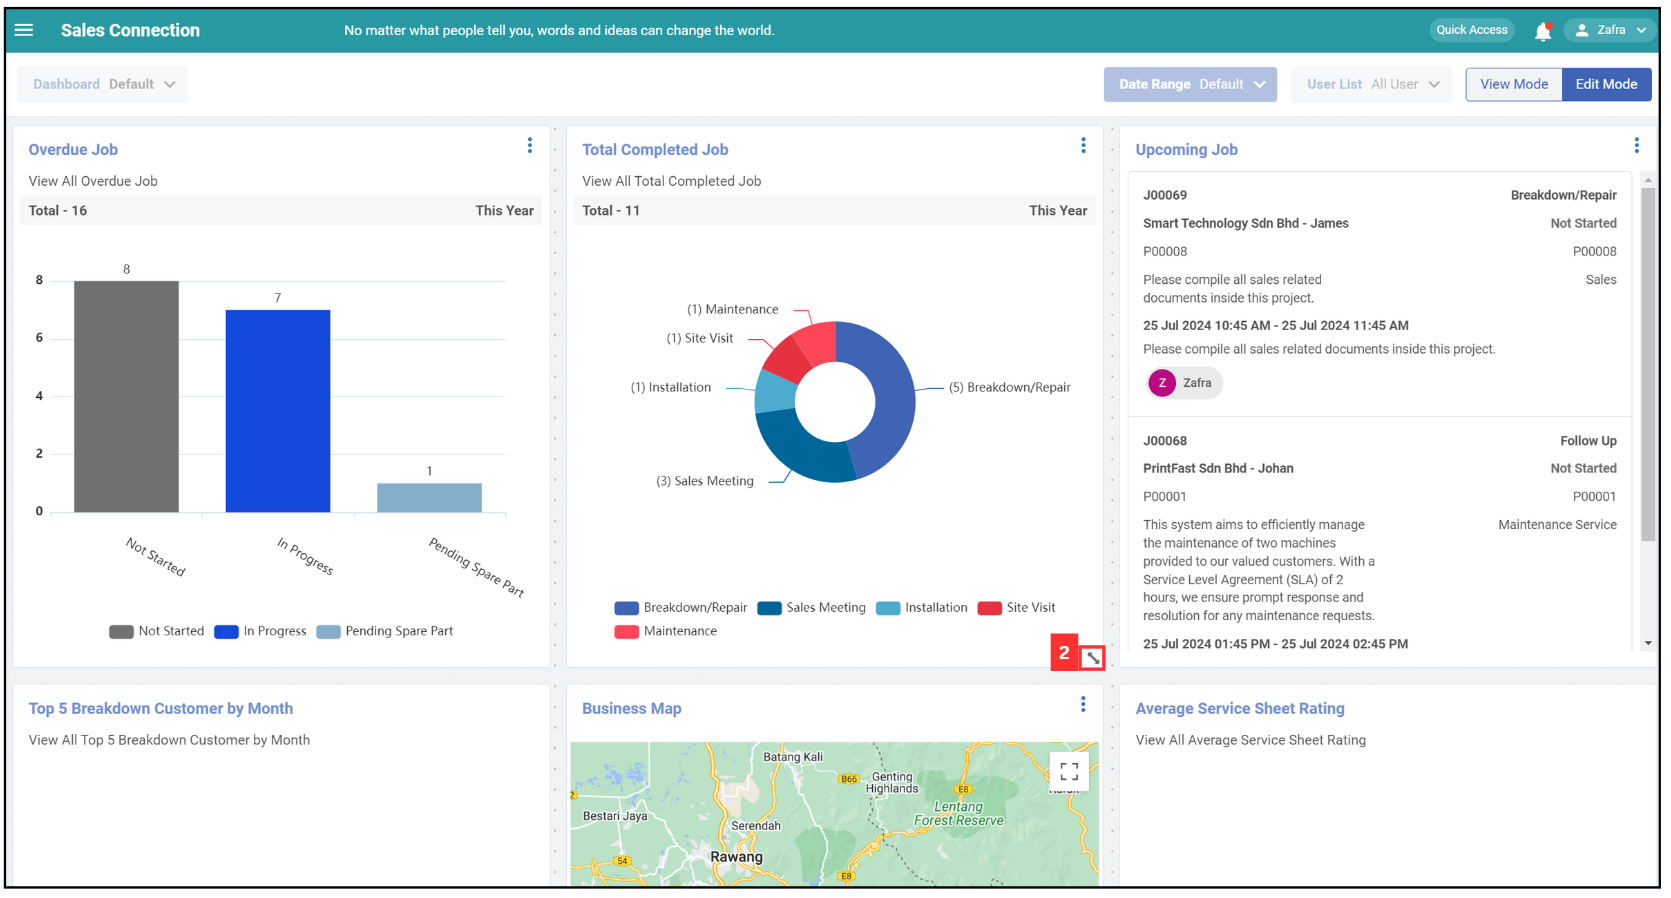
-
The adjustment has been made and will be automatically saved.
Reposition Chart
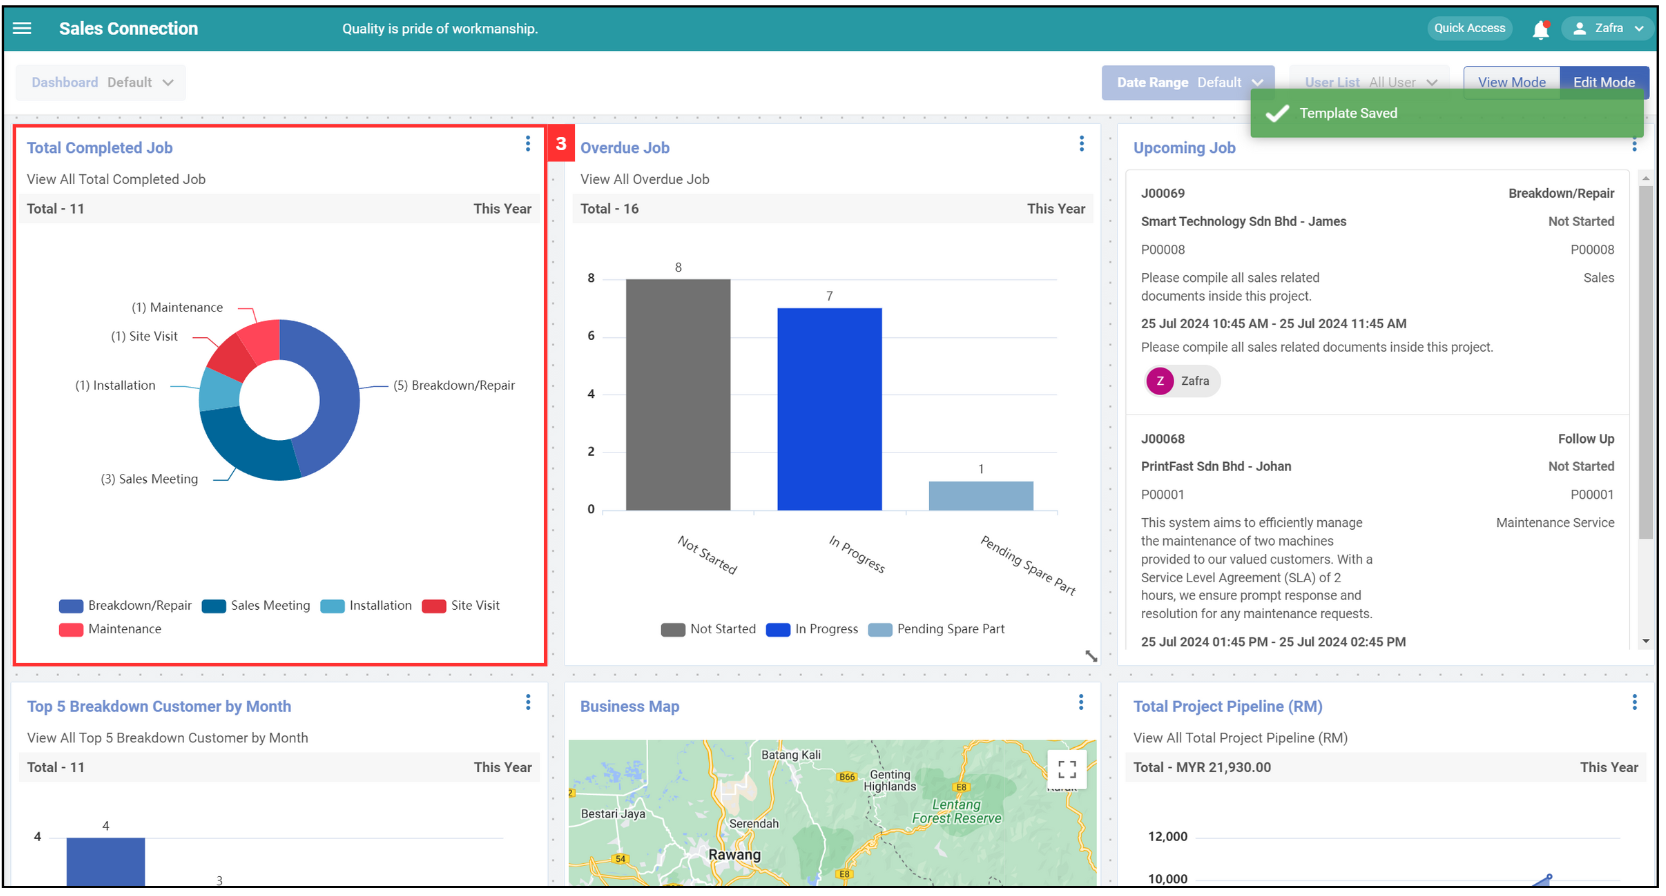
-
Long click the chart you want to reposition.
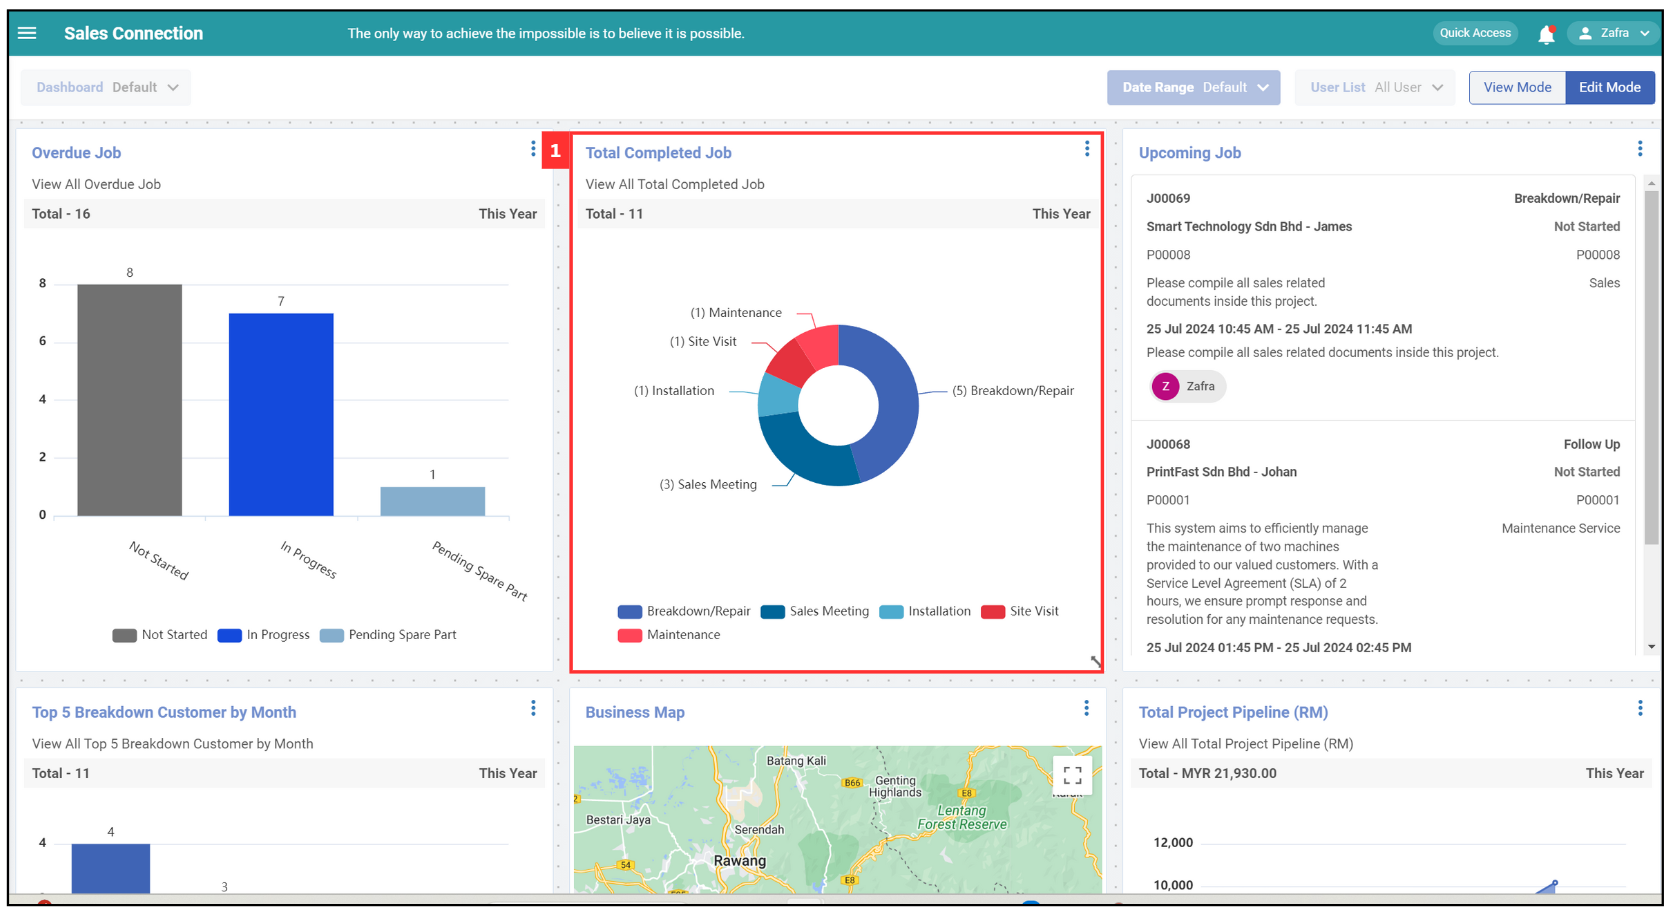
-
Drag the chart to the desired location.
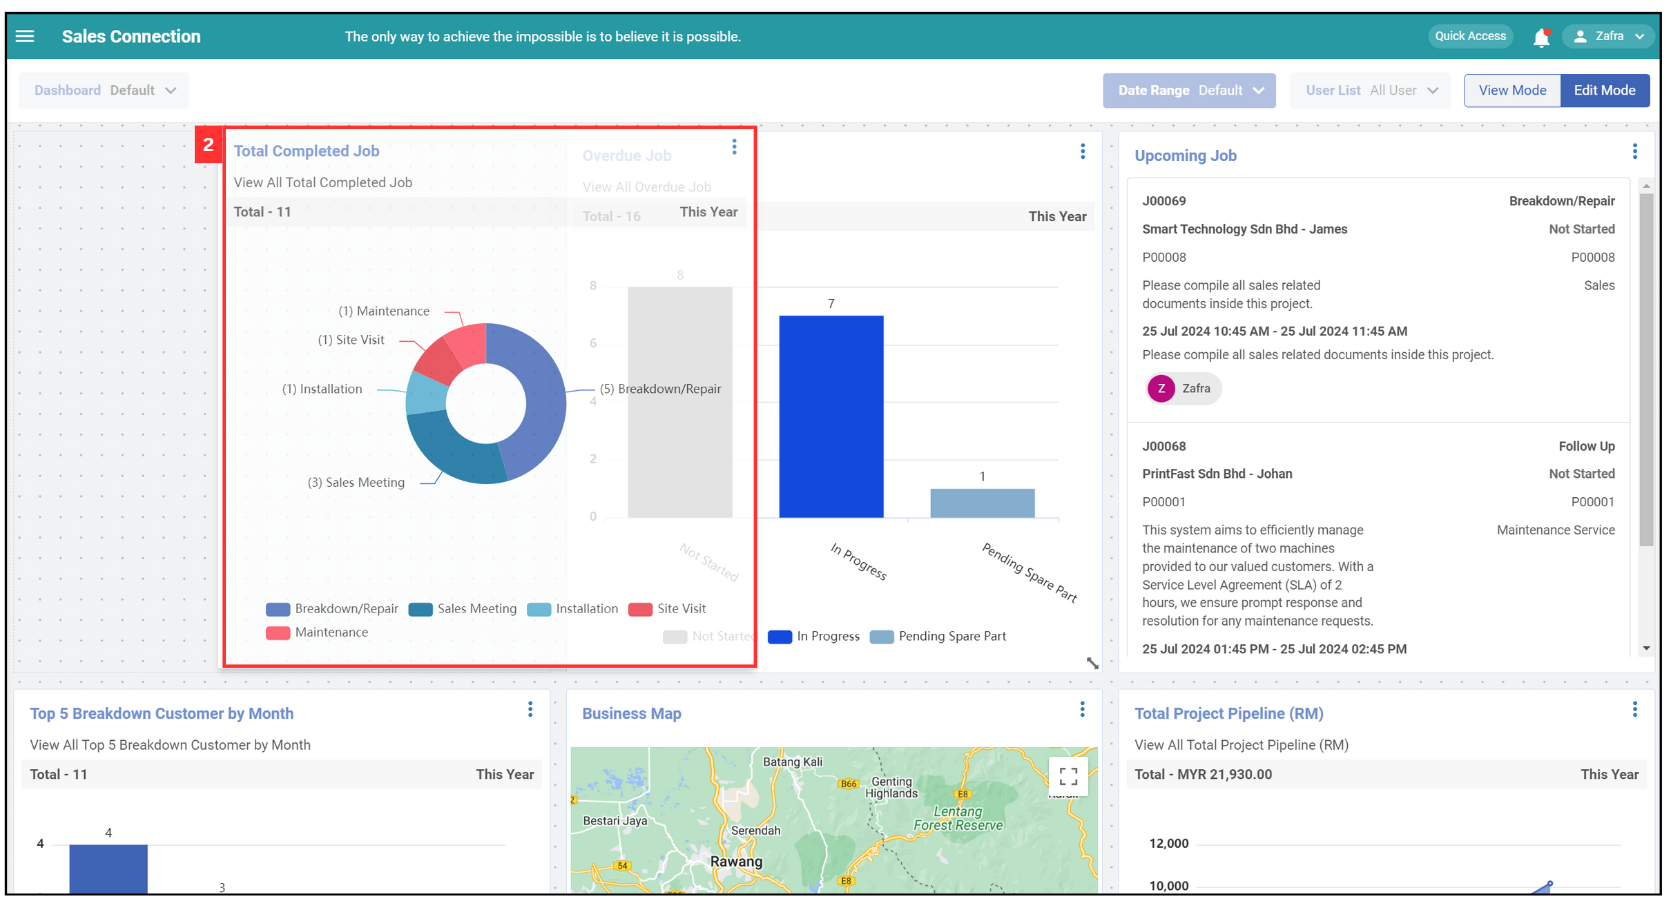
-
The adjustment has been made and will be automatically saved.
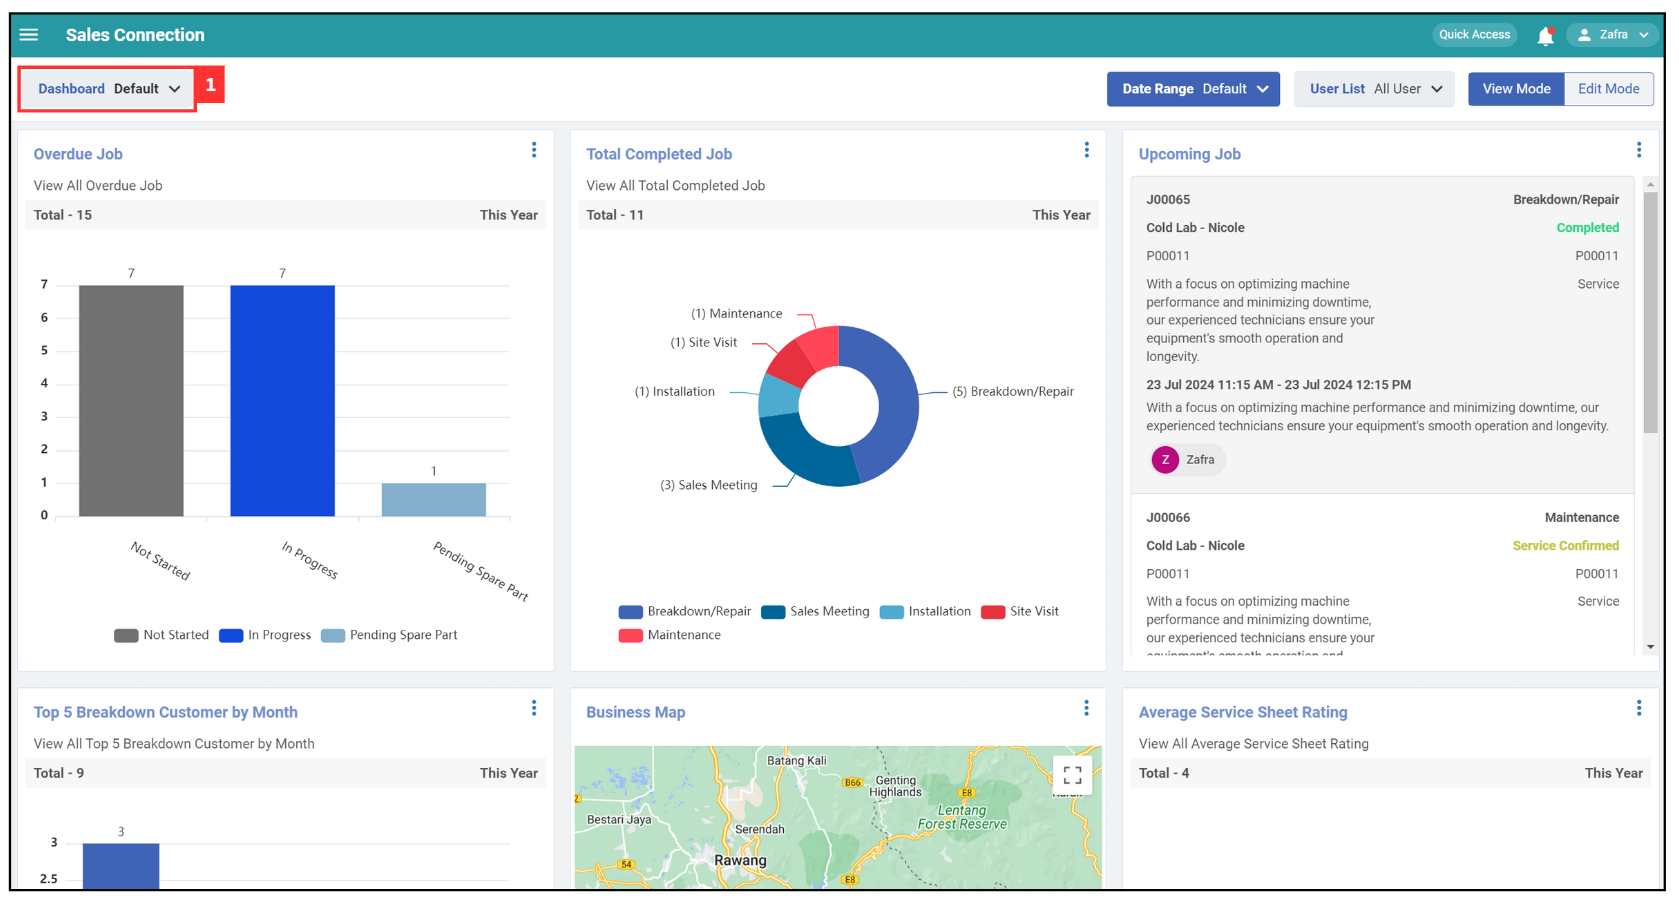
Select Group
-
Click on “Dashboard” at the top left corner of the page.
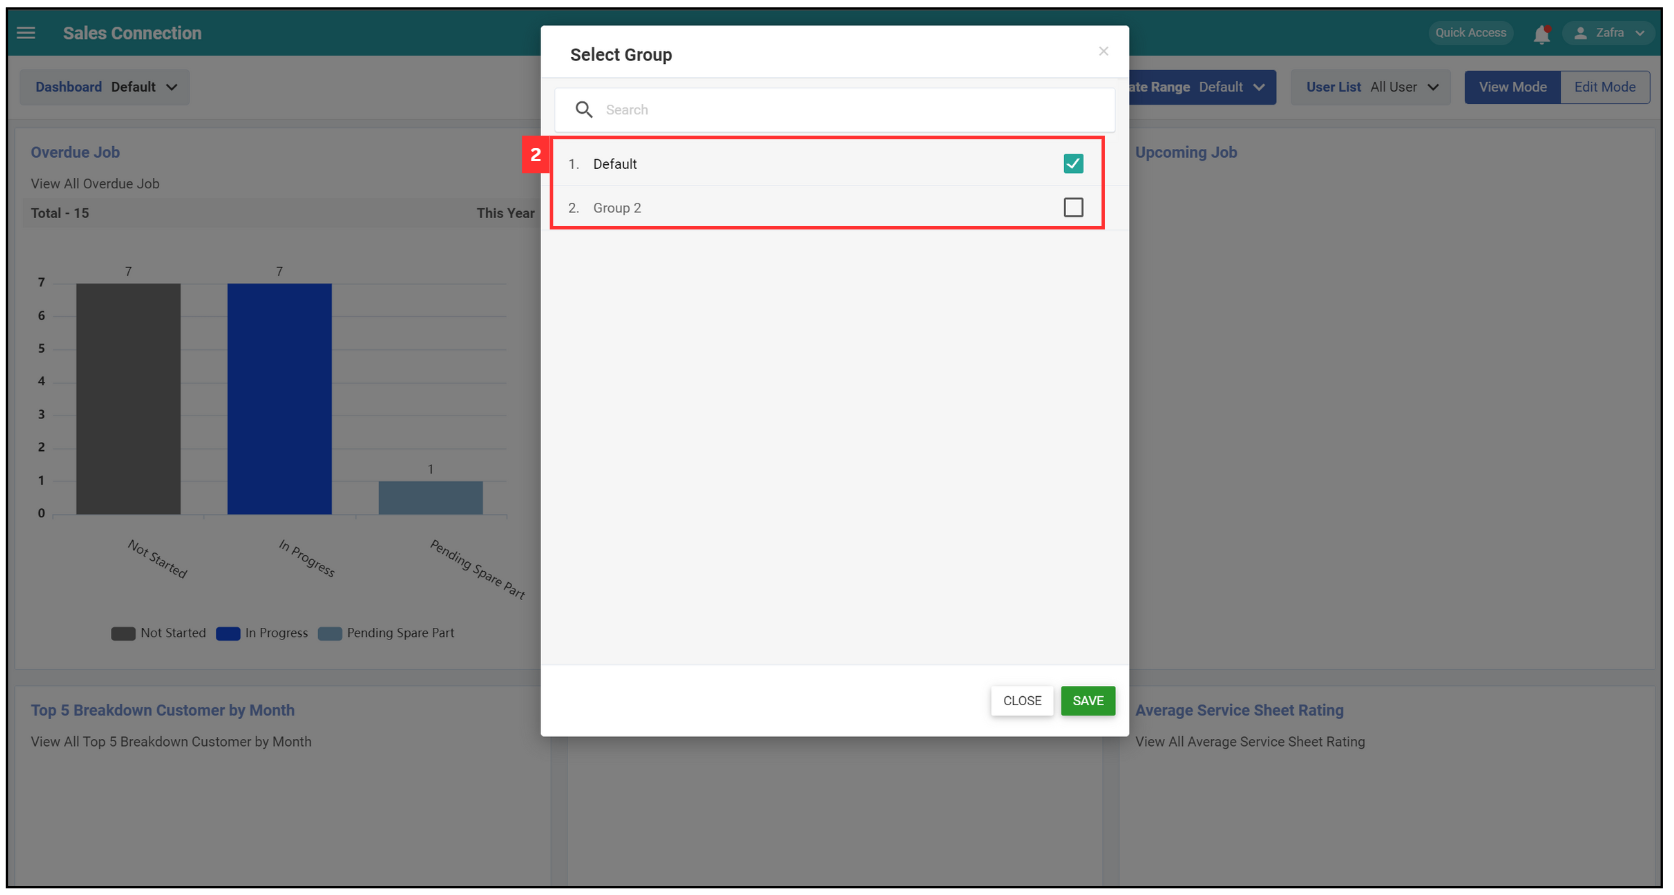
-
Tick the box to select a group for your dashboard.
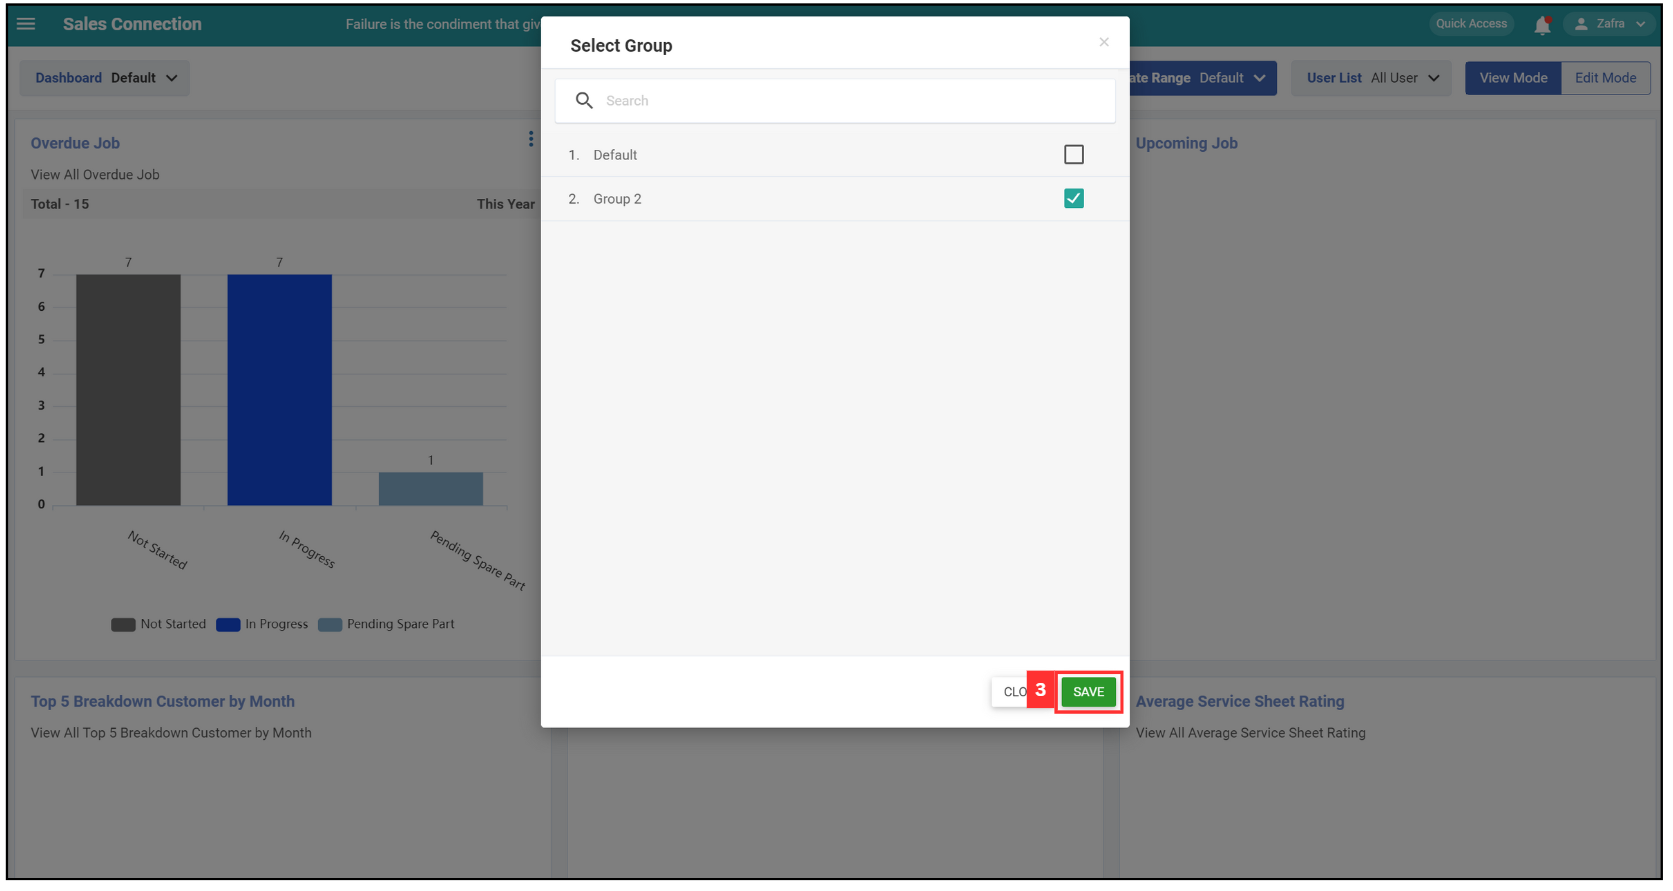
-
Click “Save”.
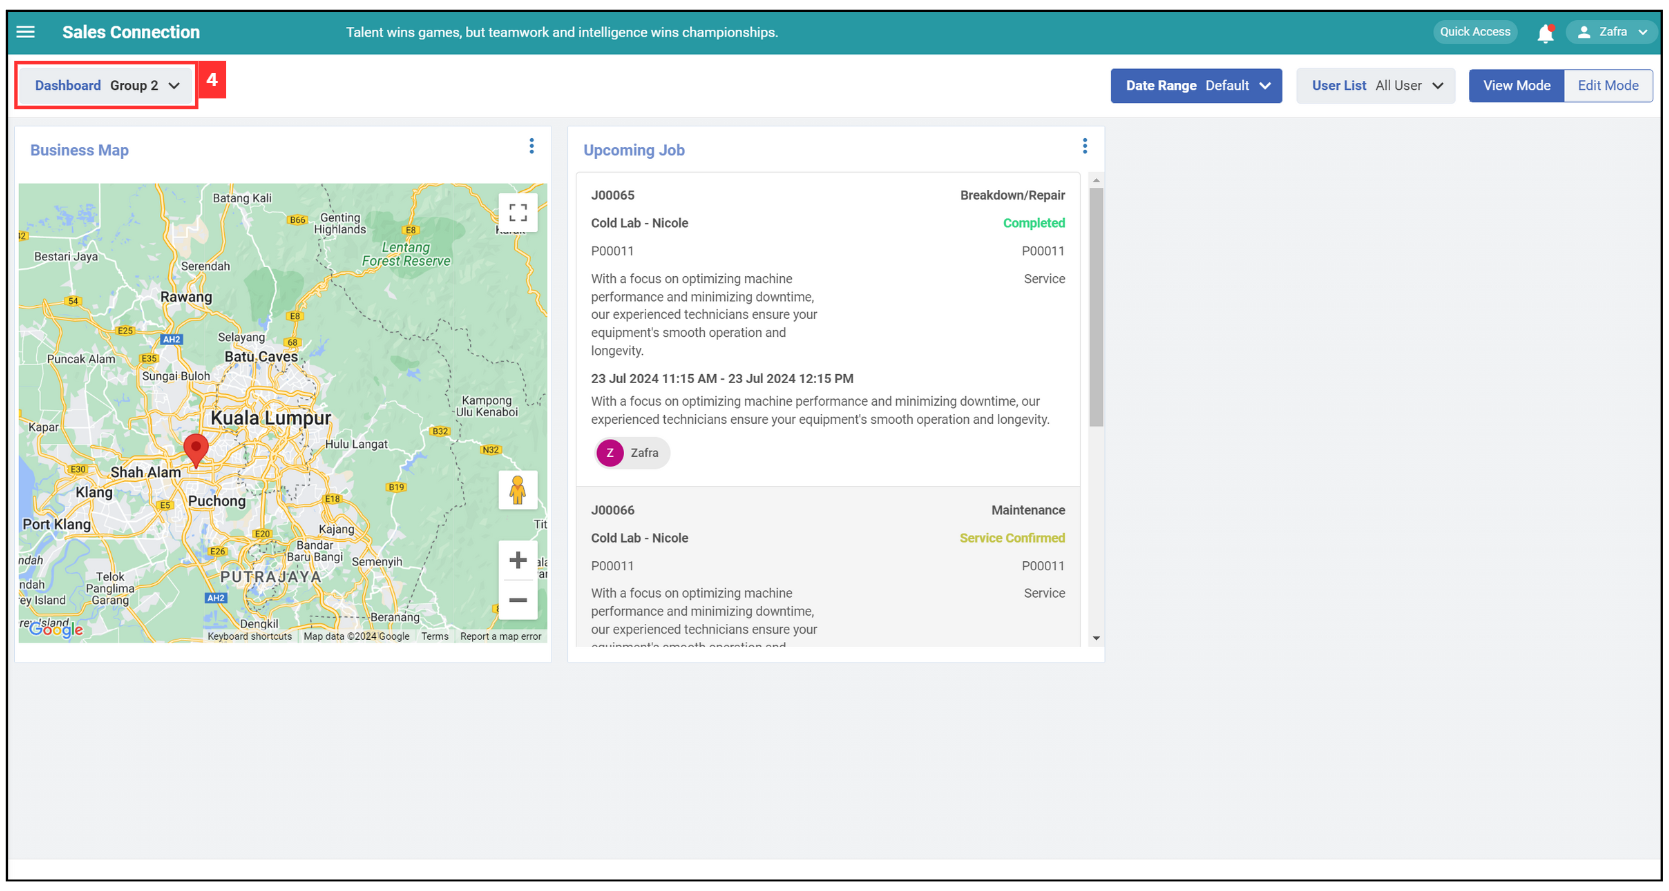
-
The dashboard has been applied successfully.
Related Articles